go-statistics is the statistics layer of the Go scientific stack built on go-ndarray: 32 univariate and 3 multivariate distributions with every method of a frozen SciPy distribution, descriptive statistics with NumPy's quantiles, and the statistical tests. Every distribution function is measured in ULPs against mpmath, with SciPy measured on the same points, and for the same seed the draws are SciPy's. No cgo, no assembly.
func main() {
	// 10 000 gamma draws from seed 42: the
	// same draws SciPy makes from that seed.
	truth := stats.Gamma{A: 2.5, Loc: 0, Scale: 1.5}
	x, err := truth.Rvs(random.DefaultRNG(42), 10000)
	if err != nil {
		panic(err)
	}

	// The maximum-likelihood fit, location
	// held at 0, and a Kolmogorov–Smirnov
	// test of the draws against the fit.
	fixed := map[string]float64{"Loc": 0}
	fit, err := stats.FitGamma(x, &stats.FitOptions{Fixed: fixed})
	if err != nil {
		panic(err)
	}
	ks, err := stats.KSTest1Samp(x, fit.CDF, nil)
	if err != nil {
		panic(err)
	}

	// The densities on a grid.
	t := make([]float64, 400)
	pdf := make([]float64, len(t))
	fitted := make([]float64, len(t))
	for i := range t {
		t[i] = 16 * float64(i) / float64(len(t)-1)
		pdf[i], fitted[i] = truth.PDF(t[i]), fit.PDF(t[i])
	}

	fig, axs := plot.Subplots(1, 1, plot.FigSize(6.4, 4))
	ax := axs[0][0]
	ax.Hist(x, plot.Bins(60), plot.Density(),
		plot.Alpha(0.35), plot.Label("10 000 draws"))
	ax.Plot(t, pdf, plot.Label("Gamma(2.5, scale 1.5)"))
	ax.Plot(t, fitted, plot.LineStyle("--"),
		plot.Label(fmt.Sprintf("fit: a = %.3f, scale = %.3f",
			fit.A, fit.Scale)))
	ax.SetTitle(fmt.Sprintf(
		"Kolmogorov–Smirnov against the fit: D = %.4f, p = %.2f",
		ks.Statistic, ks.PValue))
	ax.SetXLim(0, 16)
	ax.SetXLabel(`$x$`)
	ax.Legend(plot.Loc("upper right"))
	if err := fig.SaveSVG(os.Stdout); err != nil {
		panic(err)
	}
}
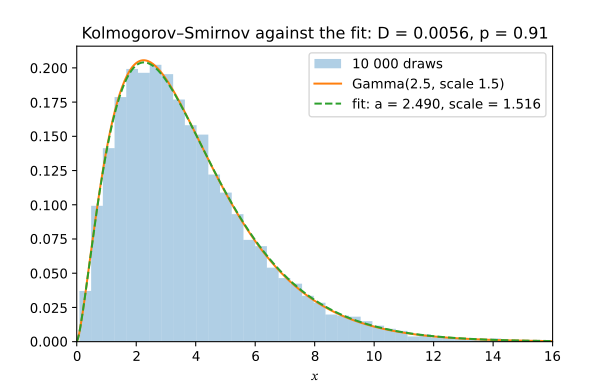
Ten thousand gamma draws from seed 42 — the same draws SciPy makes from the same seed — their histogram, the density they were drawn from, the maximum-likelihood fit, and a Kolmogorov–Smirnov test of the draws against that fit, whose result is the title. go-plot drew the SVG. The CI runs the program again and fails if one byte of the figure differs.
Everything is in package stats: distributions, descriptive statistics, tests, the kernel density estimate and the bootstrap share one input type — a []float64 or a go-ndarray array — and one set of error kinds. Each Go call names the SciPy or NumPy call it corresponds to, and option structs have their defaults as the zero value.
Normal, beta, gamma, chi-squared, Student t, F, noncentral chi-squared, log-normal, Weibull, Pareto, von Mises and more, each with pdf, cdf, sf, ppf, isf and their logarithms, moments, median, entropy, interval and support.
Bernoulli, binomial, Poisson, geometric, negative binomial, hypergeometric, discrete uniform and Zipf; the multivariate normal (with its CDF), Dirichlet and multinomial.
Rvs takes go-ndarray's random.Generator, which is NumPy's bit for bit, and makes the generator calls SciPy makes, so the same seed gives the same sample.
FitXxx with fixed parameters: SciPy's closed forms to the bit, likelihood equations polished to full precision, and elsewhere a log-likelihood at least as high as SciPy's.
Describe, weighted means and variances, NumPy's 13 quantile methods, mode, skew, kurtosis, trimmed statistics, entropies, histograms with every bin rule, binned statistics.
t-tests (Student, Welch, trimmed), chi-squared and contingency tables, Fisher's exact test, Pearson, Spearman, Kendall, Kolmogorov–Smirnov, Mann–Whitney, Wilcoxon, Kruskal–Wallis, Shapiro–Wilk, Anderson–Darling, ANOVA, Levene, Bartlett.
stats.Map(x, d.CDF) applies a method to an array over every core, each element computed once, so the result does not depend on the number of goroutines.
No cgo, no assembly. The accuracy budgets are enforced on amd64, arm64, 386, arm, riscv64, loong64, ppc64le and s390x.
The fixtures are written by scripts that call the references — mpmath 1.4.1 at 192 and 320 bits, SciPy 1.18.1 and NumPy 2.5.4 (x86-64 builds) — committed, and compared by go test. SciPy is a point of comparison, never the reference. What differs, and why, is in the accuracy document.
256 fixtures, 1479 regions, about 212 000 points, each against mpmath at 192 and 320 bits: the maximum error is at or below SciPy’s in 1473 regions. The six exceptions are the beta sf and ppf, all under 4.5 ulp.
Every normal function at or below 0.55 ulp. Gamma, chi, chi-squared, inverse gamma, beta and t densities at or below 1.3 ulp where SciPy loses up to 10⁷ ulp at large shapes; binomial, Poisson and negative binomial masses at or below 0.5 ulp.
For the same seed, the draws of 17 distributions (normal, t, exponential, uniform, all eight discrete ones…), Dirichlet, multinomial and the bootstrap resamples are bit-identical to SciPy’s. Twelve others differ in a few draws per thousand by 1–4 ulp; Cauchy, inverse gamma and von Mises differ more, and the table says how much.
Means, variances, standard deviations, medians, all 13 quantile methods (also weighted), histograms and bin edges: bit-identical to NumPy 2.5.4 over tens of thousands of values.
About 4100 SciPy cases and 3100 exact references: statistics and p-values agree with SciPy to 1.4e-13 relative, except where the exact reference shows SciPy is off — Fisher’s exact test, exact Kolmogorov–Smirnov and Mann–Whitney, Anderson–Darling.
One thing broken at a time — Loader’s Stirling coefficient 1/1260 moved to 1/1261, Kendall’s variance 2n+5 to 2n+6, a 1/24 in expm1 to 1/23 — and each break makes the suite fail. The budgets hold on amd64, arm64, 386, arm, riscv64, loong64, ppc64le and s390x.
Medians of 7 interleaved rounds against SciPy 1.18.1 / NumPy 2.5.4 (native arm64 wheels) on a shared 16-core arm64 Mac, from the library's docs/perf.md. Go runs on all cores (stats.Map), SciPy on one, as each runs; single core, the scalar functions cost 2–15× SciPy's C loops. The rows in the library's colour are where SciPy is faster.
| case | go-statistics | SciPy 1.18.1 | SciPy / Go |
|---|---|---|---|
| norm.cdf, 10⁶ points | 17.9 ms | 29.8 ms | 1.66× |
| beta.pdf, 10⁶ points | 77.9 ms | 94.2 ms | 1.21× |
| norm.ppf, 10⁶ points | 43.9 ms | 27.1 ms | 0.62× |
| t.ppf, 10⁵ points | 1096 ms | 49.7 ms | 0.05× |
| describe, 10⁶ values | 59.8 ms | 183.5 ms | 3.07× |
| percentile (5 q), 10⁶ values | 27.2 ms | 40.7 ms | 1.50× |
| spearmanr, 10⁶ pairs | 368 ms | 861 ms | 2.34× |
| pearsonr, 10⁶ pairs | 97.0 ms | 5.94 ms | 0.06× |
| ttest_ind, 10⁶ + 10⁶ | 7.74 ms | 6.80 ms | 0.88× |
| gaussian_kde evaluate, 10⁴ × 10⁴ | 113 ms | 916 ms | 8.07× |
24 continuous, 8 discrete and 3 multivariate distributions with pdf, cdf, sf, ppf, isf and their logarithms, moments, entropy, draws and fits; descriptive statistics with NumPy's 13 quantile methods; hypothesis tests, correlations and linear regression; the Gaussian KDE and the bootstrap. Every distribution function measured in ULPs against mpmath.
The documentation (Hugo + Hextra), built from the library's own README and docs/: design, accuracy, the per-region accuracy table, draws and speed. Source →
Logos and icons for the organization, in SVG / PNG / JPG / ICO / ICNS across colour, white and black variants; the mark is a normal density, computed by a Go program.
go-statistics computes on the arrays of go-ndarray and draws from its NumPy-exact generator, takes its special functions and optimisers from go-numerics, plots with go-plot, and a go-notebook cell can use all of them. Where the library is slower or less accurate than SciPy, the documentation says so.
Read the source on GitHub → go-statistics